Python - Concept#
In this we are going to learn some python Basic concepts
Python Basics#
import numpy as np
import pandas as pd
import os
import matplotlib.pyplot as plt
# A string within a pair of triple single quotes, can have multiple lines
seq_5 = '''MALNSGSPPA
IGPYYENHGY HHSYSYSH
UUYSTTSGSG'''
print(seq_5)
print('---------')
MALNSGSPPA
IGPYYENHGY HHSYSYSH
UUYSTTSGSG
---------
dna_seq = 'ATGCGGCTCAGCATGCGACTATATATGCCACTACCGCGCCGC'

print(dna_seq.lower())

print("---------")

print(dna_seq)

print("------------")

print(dna_seq.count("GC"))
print(dna_seq.count("AT"))
print("--------")
print(dna_seq.find("GCATG"))
print(dna_seq[10:19])
print(dna_seq.rfind("CCGC"))
print(len(dna_seq))
print(dna_seq.swapcase())
print(dna_seq.replace("CCGC", "ATCGC", 2))
print(dna_seq.rfind("ATGC"))
atgcggctcagcatgcgactatatatgccactaccgcgccgc
---------
ATGCGGCTCAGCATGCGACTATATATGCCACTACCGCGCCGC
------------
8
5
--------
10
GCATGCGAC
38
42
atgcggctcagcatgcgactatatatgccactaccgcgccgc
ATGCGGCTCAGCATGCGACTATATATGCCACTAATCGCGATCGC
24
dna_seq[4:-5]
'GGCTCAGCATGCGACTATATATGCCACTACCGC'
first_row = '6,148,72,35,0,33.6,0.627,50,1'

Pregnancies,Glucose,BloodPressure,SkinThickness,Insulin,BMI,DiabetesPedigreeFunction,Age,Outcome = first_row.split(',')

print(Age)
print(BloodPressure)
print(Outcome)
50
72
1
drug_name = ["dapoline", "crocin", "cyclopam", "eldoper"]
drug_name
drug_name[:3]
['dapoline', 'crocin', 'cyclopam']
list_in_list = [[2,3,4], ["str", "df", "wer"], [23,12], [10,23,111,231,12,145]]
list_in_list
print(list_in_list)
print(list_in_list[3][2:5])
[[2, 3, 4], ['str', 'df', 'wer'], [23, 12], [10, 23, 111, 231, 12, 145]]
[111, 231, 12]
x=drug_name.remove("crocin")
print(drug_name)
['dapoline', 'cyclopam', 'eldoper']
print(drug_name.sort())
print(drug_name)
None
['cyclopam', 'dapoline', 'eldoper']
print(type(list_in_list))
print(type(first_row))
<class 'list'>
<class 'str'>
dict1 = {"list1" : [1,2,3], "list2" : [4,6]}
print(dict1)

print(dict1.get("list1"))

print(dict1["list1"][0])

dict2 = {"list3" : ["star", "month"], "list4": ["washing", "belgium"]}

dict = {**dict1, **dict2}
print(dict)
print(dict.keys())
{'list1': [1, 2, 3], 'list2': [4, 6]}
[1, 2, 3]
1
{'list1': [1, 2, 3], 'list2': [4, 6], 'list3': ['star', 'month'], 'list4': ['washing', 'belgium']}
dict_keys(['list1', 'list2', 'list3', 'list4'])
protein = { 'uniprot_ID' : 'P232425', 'Name' : 'Prolinte', 'seq' : 'ATGGTTGSFMN', 'lenght' : 10 }
print(protein)
print(type(protein))
{'uniprot_ID': 'P232425', 'Name': 'Prolinte', 'seq': 'ATGGTTGSFMN', 'lenght': 10}
<class 'dict'>
print(True == False)
False
control_expr = 9
treated_expr = 3.7
if control_expr < treated_expr:
  print("Gene downregulated")
else:
  print("Gene Upregulated")
Gene Upregulated
gene1_length = 10
gene2_length = 15
gene3_length = 40

if gene1_length < gene2_length:
  print(" Gene 2 is longer than gene1")
if gene3_length > gene2_length:
  print("Gene3 is longest of all 3 genes")
 Gene 2 is longer than gene1
Gene3 is longest of all 3 genes
#!pip install colorama
Looking in indexes: https://pypi.org/simple, https://us-python.pkg.dev/colab-wheels/public/simple/
Collecting colorama
  Downloading colorama-0.4.5-py2.py3-none-any.whl (16 kB)
Installing collected packages: colorama
Successfully installed colorama-0.4.5
#----- To check presence of an item in list and substring of string --- #we use in keyword
from colorama import Fore, Back, Style


usr_input = input("please enter drug name: ")

if usr_input in drug_name:
  print(f"{Fore.WHITE} {Back.GREEN} {Style.BRIGHT} {usr_input}  ")
else:
  print(f"{Fore.WHITE} {Back.RED} {Style.BRIGHT} {usr_input} ")
please enter drug name: sinus77
   sinus77
#-----while Loop  is uses stop-condition //// untill stop condition is true the statement executed
a = int(input("enter a value: "))

while a < 6:
  print(f" {a} is bigger than 6")
  a = a+1
else:
  print(f"{a} is smaller than 6")
enter a value: 3
 3 is bigger than 6
 4 is bigger than 6
 5 is bigger than 6
6 is smaller than 6
dna_list = ['AGGGC','ATTGGCCTT','AGGTTCC','GGCCTCA','TTTCCGGCTA','CCGCGTA']

print(dna_list)

print(len(dna_list))
['AGGGC', 'ATTGGCCTT', 'AGGTTCC', 'GGCCTCA', 'TTTCCGGCTA', 'CCGCGTA']
6
# to find longer dna from dna_list we need lenght of each dna items , so to find each dna item length we use index
print(len(dna_list))  # lenght of list , total number of items
print(len(dna_list[1]))  # lenght of charcters in dna item from dna list at 1 st index
6
9
number_of_items = len(dna_list)
#print(number_of_items)

index = 0 # start with 0 th element
# now we have index start and total elements now we can loop
longer = 0
while(index < number_of_items):
  print(index)
  current = len(dna_list[index])
  print("length is ", current)
  print("-------------")
  if current > longer:
    longer = current
    print("new longer dna is: ",longer)
    longer_dna_index = dna_list[index]
    print("longer dna  is :", longer_dna_index, "and lenght is ", longer)


  index = index + 1

print("longest dna  is :", longer_dna_index, "and lenght is ", longer)
0
length is  5
-------------
new longer dna is:  5
longer dna  is : AGGGC and lenght is  5
1
length is  9
-------------
new longer dna is:  9
longer dna  is : ATTGGCCTT and lenght is  9
2
length is  7
-------------
3
length is  7
-------------
4
length is  10
-------------
new longer dna is:  10
longer dna  is : TTTCCGGCTA and lenght is  10
5
length is  7
-------------
longest dna  is : TTTCCGGCTA and lenght is  10
number_of_items = len(dna_list)
index = 0
longer = 0

while(index < number_of_items):
  current = len(dna_list[index])
  if current > longer:
    longer = current
    long_dna = dna_list[index]
  index = index +1

print(long_dna, longer)
TTTCCGGCTA 10
for x in dna_list:
  index = 0
  current = len(dna_list[index])
  if current > longer:
    longer = current
  index = index + 1
print(longer)
10
for drug in drug_name:
  print(drug)
dapoline
crocin
cyclopam
eldoper
import numpy as np

for x in range(10):
  x = x**2+np.sin(x)
  print(x)
0.0
1.8414709848078965
4.909297426825682
9.141120008059866
15.243197504692072
24.04107572533686
35.72058450180107
49.65698659871879
64.98935824662338
81.41211848524176
for x in range(6 ,10):
  print(x)
6
7
8
9
def Biolove():
  print("I love Biology")

Biolove()
I love Biology
#--- if we have set of control expression and treated expression of a gene then finding mean expression and calculating which is upregulated

control_expr = [2,4.0, 5.3, 8, 12]
treated_expr = [14, 23, 0.3,0.5, 1.3]

print(len(control_expr))
print(len(treated_expr))

def Mean_expr(expression):
  total_items = len(expression)
  total_exp =  sum(expression)
  mean_expr = (total_exp/total_items)
  print(total_exp)
  return mean_expr

control_mean_expr = Mean_expr(control_expr)
treated_mean_expr = Mean_expr(treated_expr)

if control_mean_expr > treated_mean_expr:
  print("control is upregulated by", control_mean_expr - treated_mean_expr)

else:
  print("Treated is upregulated by", treated_mean_expr - control_mean_expr)
5
5
31.3
39.099999999999994
Treated is upregulated by 1.5599999999999987
import random
for i in range(10):
  x = random.random()
  print(x)
0.2370533475793002
0.618866633308759
0.3693540170724592
0.6234544733235856
0.6391075513952862
0.8020779639302317
0.8054811697150666
0.18663645783024552
0.2873486855738768
0.23477485117858765
# Define class

class Mrna:
  # class attribute
  contains = "Nucleic Acid"
  # initializer with instance attributes
  def __init__(self, gene_name,seq):

      self.gene_name = gene_name
      self.seq = seq
  # method-1
  def Details(self):
    print("Gene name is ", self.gene_name, " and sequence is ", self.seq)

  # method -2
  def cDNA(self):
    print("its complimentary dna is ", self.seq.replace("U","T"))
mRNA_1 = Mrna("IGKJ1", "GUGGACGUUCGGCCAAGGGACCAAGGUGGAAAUCAAAC")

mRNA_1.Details()
Gene name is IGKJ1 and sequence is GUGGACGUUCGGCCAAGGGACCAAGGUGGAAAUCAAAC
Biopython#
from platform import python_version
print(python_version())

!pip install biopython
#!pip install --upgrade biopython
import Bio
print(Bio.__version__)
3.7.13
Looking in indexes: https://pypi.org/simple, https://us-python.pkg.dev/colab-wheels/public/simple/
Collecting biopython
  Downloading biopython-1.79-cp37-cp37m-manylinux_2_5_x86_64.manylinux1_x86_64.whl (2.3 MB)
     |████████████████████████████████| 2.3 MB 26.9 MB/s
?25hRequirement already satisfied: numpy in /usr/local/lib/python3.7/dist-packages (from biopython) (1.21.6)
Installing collected packages: biopython
Successfully installed biopython-1.79
1.79
# Like above we have created class which do 2 functions . like wise biopython has class Seq to do various functions
import Bio
from Bio.Seq import Seq

my_seq = Seq("ATGCGGCTAAT")
print(type(my_seq))
<class 'Bio.Seq.Seq'>
# it is important to mention whether it is DNA or RNA in biophython sequence , we get generic dna from Bio.Alphabet


my_seq = Seq("ATGCTAGGCATAG")
dna = Seq("ATGGTGGCCATTGTAATGGGCCGCTGAAAGGGTGCCCGATAG")
print(type(dna))
print(len(dna))

transcript = dna.transcribe()
print(transcript)
print(type(transcript))

protein1  = transcript.translate()
print(protein1)
print(len(protein1))

protein2  = transcript.translate(table= 2, cds=True)
print(protein2)
print(len(protein2))

protein3 = dna.translate()
print(protein3)
<class 'Bio.Seq.Seq'>
42
AUGGUGGCCAUUGUAAUGGGCCGCUGAAAGGGUGCCCGAUAG
<class 'Bio.Seq.Seq'>
MVAIVMGR*KGAR*
14
MVAIVMGRWKGAR
13
MVAIVMGR*KGAR*
—-SeqRecord
from typing import Generic
from Bio.Seq import Seq


from Bio.SeqRecord import SeqRecord

pr_record = SeqRecord(Seq("MRAKWRKKRMRRLKRKRRKMRQRSK"), id = "P62945", name= "RL41_HUMAN", description= "60S ribosomal protein L41" )

print(pr_record)
print(type(pr_record))
ID: P62945
Name: RL41_HUMAN
Description: 60S ribosomal protein L41
Number of features: 0
Seq('MRAKWRKKRMRRLKRKRRKMRQRSK')
<class 'Bio.SeqRecord.SeqRecord'>
from Bio import SeqIO

from Bio.Seq import Seq

from Bio.SeqRecord import SeqRecord

NC_005816_record = SeqIO.read("/content/drive/MyDrive/GenBank_data/NC_005816.gb", "genbank")
print(NC_005816_record)
ID: NC_005816.1
Name: NC_005816
Description: Yersinia pestis biovar Microtus str. 91001 plasmid pPCP1, complete sequence
Database cross-references: BioProject:PRJNA224116, BioSample:SAMN02602970, Assembly:GCF_000007885.1
Number of features: 19
/molecule_type=DNA
/topology=circular
/data_file_division=CON
/date=19-JUN-2022
/accessions=['NC_005816']
/sequence_version=1
/keywords=['RefSeq']
/source=Yersinia pestis biovar Microtus str. 91001
/organism=Yersinia pestis biovar Microtus str. 91001
/taxonomy=['Bacteria', 'Proteobacteria', 'Gammaproteobacteria', 'Enterobacterales', 'Yersiniaceae', 'Yersinia']
/references=[Reference(title='Genetics of metabolic variations between Yersinia pestis biovars and the proposal of a new biovar, microtus', ...), Reference(title='Complete genome sequence of Yersinia pestis strain 91001, an isolate avirulent to humans', ...), Reference(title='Direct Submission', ...)]
/comment=REFSEQ INFORMATION: The reference sequence is identical to
AE017046.1.
The annotation was added by the NCBI Prokaryotic Genome Annotation
Pipeline (PGAP). Information about PGAP can be found here:
https://www.ncbi.nlm.nih.gov/genome/annotation_prok/
COMPLETENESS: full length.
/structured_comment=OrderedDict([('Genome-Annotation-Data', OrderedDict([('Annotation Provider', 'NCBI RefSeq'), ('Annotation Date', '06/19/2022 10:59:08'), ('Annotation Pipeline', 'NCBI Prokaryotic Genome Annotation Pipeline (PGAP)'), ('Annotation Method', 'Best-placed reference protein set; GeneMarkS-2+'), ('Annotation Software revision', '6.1'), ('Features Annotated', 'Gene; CDS; rRNA; tRNA; ncRNA; repeat_region'), ('Genes (total)', '4,363'), ('CDSs (total)', '4,259'), ('Genes (coding)', '4,040'), ('CDSs (with protein)', '4,040'), ('Genes (RNA)', '104'), ('rRNAs', '8, 7, 7 (5S, 16S, 23S)'), ('complete rRNAs', '8, 7, 7 (5S, 16S, 23S)'), ('tRNAs', '72'), ('ncRNAs', '10'), ('Pseudo Genes (total)', '219'), ('CDSs (without protein)', '219'), ('Pseudo Genes (ambiguous residues)', '0 of 219'), ('Pseudo Genes (frameshifted)', '95 of 219'), ('Pseudo Genes (incomplete)', '151 of 219'), ('Pseudo Genes (internal stop)', '32 of 219'), ('Pseudo Genes (multiple problems)', '49 of 219'), ('CRISPR Arrays', '1')]))])
/contig=join(AE017046.1:1..9609)
Undefined sequence of length 9609
from Bio.Seq import Seq
from Bio.SeqRecord import SeqRecord
sequence = ""
with open("/content/drive/MyDrive/GenBank_data/sample.fasta.txt", "r") as f:
  lines = f.readlines()
  for line in lines:
    if line.startswith(">"):
      description= line.rstrip()
    else:
      sequence = sequence + line.rstrip()

protein_record = SeqRecord(Seq(sequence), id = description, name= description, description= description)

print(protein_record)
ID: >sp|Q9SE35|20-107
Name: >sp|Q9SE35|20-107
Description: >sp|Q9SE35|20-107
Number of features: 0
Seq('QSIADLAAANLSTEDSKSAQLISADSSDDASDSSVESVDAASSDVSGSSVESVD...RIL')
# Above code write with minimal lines of code using biopython parse method

from Bio.Seq import Seq
from Bio.SeqRecord import SeqRecord
from Bio import SeqIO

records = Bio.SeqIO.parse("/content/drive/MyDrive/GenBank_data/sample.fasta.txt", "fasta")
for record in records:
  print(record)
ID: sp|Q9SE35|20-107
Name: sp|Q9SE35|20-107
Description: sp|Q9SE35|20-107
Number of features: 0
Seq('QSIADLAAANLSTEDSKSAQLISADSSDDASDSSVESVDAASSDVSGSSVESVD...RIL')
# Multi sequence fasta file

from Bio.Seq import Seq
from Bio.SeqRecord import SeqRecord
from Bio import SeqIO

# records_list = []

# records =  Bio.SeqIO.parse("/content/drive/MyDrive/GenBank_data/multisequence.txt", "fasta")

#for record in records:
  #print(record.id)
  #records_list.append(record)


# record_list = []
for record in Bio.SeqIO.parse("/content/drive/MyDrive/GenBank_data/multisequence.fasta.txt", "fasta"):
  print(record.id)
  #record_list.append(record)
spQ3ZM63ETDA_HUMAN
spP53803RPAB4_HUMAN
spQ538Z0LUZP6_HUMAN
spQ9BZ97TTY13_HUMAN
spP58511SI11A_HUMAN
seq1 = "TGATGCACATTGA"
seq2 = "TAGACATGACACCACAG"

from Bio import Align

aligner = Align.PairwiseAligner()
aligner
print(aligner)
print("\n ============== \n")
results = aligner.align(seq1, seq2)
print(results)
for each in results:
  print(each)
score = aligner.score(seq1, seq2)
print(score)
from Bio.Seq import Seq

sequence = Seq("ATTTTCTTGCTCTTGAGCTCTGGCACTTCTCTGCTGCTGTC")

from Bio.Blast import NCBIWWW
from Bio.Blast import NCBIXML
from Bio.Blast import ParseBlastTable

result_handle =NCBIWWW.qblast("blastn", "nt", sequence= sequence)
blast_records = NCBIXML.parse(result_handle)
print(blast_records)
print("----------------")
<generator object parse at 0x7f03abf1e5d0>
----------------
#blast_records = NCBIXML.parse(result_handle)

#for b in blast_records:
 # for alignment in b.alignments[:2]:
  #  print(alignment)

print(blast_records)
print("----------------")
#blast_records = NCBIXML.parse(result_handle)
for b in blast_records:

  for alignment in b.alignments[:2]:
    for hsp in alignment.hsps:
      print('****Alignment****')
      print('sequence:', alignment.title)
      print('length:', alignment.length)
      print('e value:', hsp.expect)
      print(hsp.query[0:75] + '…')
      print(hsp.match[0:75] + '…')
      print(hsp.sbjct[0:75] + '…')
<generator object parse at 0x7f03abf7c050>
----------------
Python for Data Analysis#
import numpy as np

l = [1, 2, 3]

a = np.array([1, 2, 3])

print("list is : ", l)
print("array is :", a)

# iterate over each element in list and array by using for loop

for each in l:
  print(each)

print("-------------")

for each in a:
  print(each)


print("added list is :",l + [4])
print("------------")

print("added array is:", a + 4)
print("added array with np.array is:", a + np.array(4))


# --- In list if we want to do mathematical operations like addition substraction multiplication we have use loop to iterate each element and then perform mathematical operation
# --- where as in Numpy array No need of looping directly mathematical operation perform on each element

# {Similarly ** exponent  work directly on NUmpy array No need for loope , where as for list need looping and new empty list}

l2 = []
for each in l:
  l2.append(each **2)
print(l2)

a= a **2
print(a)
list is :  [1, 2, 3]
array is : [1 2 3]
1
2
3
-------------
1
2
3
added list is : [1, 2, 3, 4]
------------
added array is: [5 6 7]
added array with np.array is: [5 6 7]
[1, 4, 9]
[1 4 9]
n =np.array( [l, l2, [5, 6, 7], [8,3,2]] )
print(n)
[[1 2 3]
 [1 4 9]
 [5 6 7]
 [8 3 2]]
n = np.array([[1,2,3], [4,5,6]])
print(n)
print("--------------")
print(n.T) # Transpose of array matrix
print("--------------")

print(np.exp(n))
print("--------------")
print(np.exp(n.T))
print("--------------")
print(np.sqrt(n))
print("--------------")
print(np.exp([[1,2,3],[4,5,6]]))
[[1 2 3]
 [4 5 6]]
--------------
[[1 4]
 [2 5]
 [3 6]]
--------------
[[  2.71828183   7.3890561   20.08553692]
 [ 54.59815003 148.4131591  403.42879349]]
--------------
[[  2.71828183  54.59815003]
 [  7.3890561  148.4131591 ]
 [ 20.08553692 403.42879349]]
--------------
[[1.         1.41421356 1.73205081]
 [2.         2.23606798 2.44948974]]
--------------
[[  2.71828183   7.3890561   20.08553692]
 [ 54.59815003 148.4131591  403.42879349]]
import numpy as np
a = np.array([[1,2,3],[4,5,6]])
b= np.array([[1,2,2]])
c=  np.array([[6,7,8], [2,4,5]])
print(a)
print("-----------")
print(b)
print("-----------")
print(c)
print("-----------")
print(a*b)
print("-----------")
print("-----------")
print(a * c)
[[1 2 3]
 [4 5 6]]
-----------
[[1 2 2]]
-----------
[[6 7 8]
 [2 4 5]]
-----------
[[ 1  4  6]
 [ 4 10 12]]
-----------
-----------
[[ 6 14 24]
 [ 8 20 30]]
import numpy as np

# Ax = B
# x = BA-1

a = np.array([[1,2,3],[4,5,6]]) #Shape(2×3)
b = np.array([[1,2],[3,4]])#Shape(2×2)

print("a is:", a)
print("----------")
print("b is :", b)
print("-----------")

print(a.dot(b))
import numpy as np
a = np.array([[5,6],[7,8]])
print("a is : \n", a)
print("----------")
print(np.linalg.det(a))
print("----------")
a_inv =np.linalg.inv(a)
print(a.shape)
print("-------")


print(np.linalg.inv(a))
print("-------")
print(a_inv.shape)

print("----------")

print(a. dot( a_inv))
a is :
 [[5 6]
 [7 8]]
----------
-2.000000000000005
----------
(2, 2)
-------
[[-4.   3. ]
 [ 3.5 -2.5]]
-------
(2, 2)
----------
[[1. 0.]
 [0. 1.]]
# solve
#   -3x 2y + 4z = 9
#   3y 2z = 5
#   4x 3y + 2z = 7


# left side is one matrix and rght side is another matrix Ax = B  ===> x = BA-1

# take the inverse  of left matrix and multiply (dot matrix muliplication)by right matrix we get solution x, y, z

A = np.array( [[-3, 2, 4], [0, 3, 2], [4, 3, 2]] )
print(A)
print("---------")

B =np.array( [9,5,7])
print(B)

print("#####################")

print(np.linalg.inv(A).dot(B)) # here x = 0.5, y= -0.125, z= 2.6875

print("---------------------------------------------------------------------------")

print(" SImilarly we can get by using np.linalg.solve method by passing 2 matrix")

print(np.linalg.solve(A, B))
[[-3  2  4]
 [ 0  3  2]
 [ 4  3  2]]
---------
[9 5 7]
#####################
[ 0.5    -0.125   2.6875]
---------------------------------------------------------------------------
 SImilarly we can get by using np.linalg.solve method by passing 2 matrix
[ 0.5    -0.125   2.6875]
Pandas
import pandas as pd

df = pd.read_csv("/content/drive/MyDrive/Diabetes/diabetes.csv")
print(type(df))
print(df.head)
print("-------------")
print(df.info())
<class 'pandas.core.frame.DataFrame'>
<bound method NDFrame.head of      Pregnancies  Glucose  BloodPressure  SkinThickness  Insulin   BMI  \
0              6      148             72             35        0  33.6
1              1       85             66             29        0  26.6
2              8      183             64              0        0  23.3
3              1       89             66             23       94  28.1
4              0      137             40             35      168  43.1
..           ...      ...            ...            ...      ...   ...
763           10      101             76             48      180  32.9
764            2      122             70             27        0  36.8
765            5      121             72             23      112  26.2
766            1      126             60              0        0  30.1
767            1       93             70             31        0  30.4

     DiabetesPedigreeFunction  Age  Outcome
0                       0.627   50        1
1                       0.351   31        0
2                       0.672   32        1
3                       0.167   21        0
4                       2.288   33        1
..                        ...  ...      ...
763                     0.171   63        0
764                     0.340   27        0
765                     0.245   30        0
766                     0.349   47        1
767                     0.315   23        0

[768 rows x 9 columns]>
-------------
<class 'pandas.core.frame.DataFrame'>
RangeIndex: 768 entries, 0 to 767
Data columns (total 9 columns):
 #   Column                    Non-Null Count  Dtype
---  ------                    --------------  -----
 0   Pregnancies               768 non-null    int64
 1   Glucose                   768 non-null    int64
 2   BloodPressure             768 non-null    int64
 3   SkinThickness             768 non-null    int64
 4   Insulin                   768 non-null    int64
 5   BMI                       768 non-null    float64
 6   DiabetesPedigreeFunction  768 non-null    float64
 7   Age                       768 non-null    int64
 8   Outcome                   768 non-null    int64
dtypes: float64(2), int64(7)
memory usage: 54.1 KB
None
df.columns= ['Pregnancies', 'Glucose', 'BP', 'ST', 'Insulin','BMI', 'DPF', 'Age', 'Outcome']
df.head()
print(df["Glucose"])
print(type(df["Glucose"]))

print("-------------------------------------------")

print(df[["Age","BMI","Outcome"]])
print(type(df[["Age","BMI","Outcome"]]))
0      148
1       85
2      183
3       89
4      137
      ...
763    101
764    122
765    121
766    126
767     93
Name: Glucose, Length: 768, dtype: int64
<class 'pandas.core.series.Series'>
-------------------------------------------
     Age   BMI  Outcome
0     50  33.6        1
1     31  26.6        0
2     32  23.3        1
3     21  28.1        0
4     33  43.1        1
..   ...   ...      ...
763   63  32.9        0
764   27  36.8        0
765   30  26.2        0
766   47  30.1        1
767   23  30.4        0

[768 rows x 3 columns]
<class 'pandas.core.frame.DataFrame'>
df.head()
| Pregnancies | Glucose | BP | ST | Insulin | BMI | DPF | Age | Outcome | |
|---|---|---|---|---|---|---|---|---|---|
| 0 | 6 | 148 | 72 | 35 | 0 | 33.6 | 0.627 | 50 | 1 |
| 1 | 1 | 85 | 66 | 29 | 0 | 26.6 | 0.351 | 31 | 0 |
| 2 | 8 | 183 | 64 | 0 | 0 | 23.3 | 0.672 | 32 | 1 |
| 3 | 1 | 89 | 66 | 23 | 94 | 28.1 | 0.167 | 21 | 0 |
| 4 | 0 | 137 | 40 | 35 | 168 | 43.1 | 2.288 | 33 | 1 |
df.loc[2:4:,"BP": "DPF"]
| BP | ST | Insulin | BMI | DPF | |
|---|---|---|---|---|---|
| 2 | 64 | 0 | 0 | 23.3 | 0.672 |
| 3 | 66 | 23 | 94 | 28.1 | 0.167 |
| 4 | 40 | 35 | 168 | 43.1 | 2.288 |
print(df.iloc[2:5])
print(df.loc[2:5])
   Pregnancies  Glucose  BP  ST  Insulin   BMI    DPF  Age  Outcome
2            8      183  64   0        0  23.3  0.672   32        1
3            1       89  66  23       94  28.1  0.167   21        0
4            0      137  40  35      168  43.1  2.288   33        1
   Pregnancies  Glucose  BP  ST  Insulin   BMI    DPF  Age  Outcome
2            8      183  64   0        0  23.3  0.672   32        1
3            1       89  66  23       94  28.1  0.167   21        0
4            0      137  40  35      168  43.1  2.288   33        1
5            5      116  74   0        0  25.6  0.201   30        0
df.head()
| Pregnancies | Glucose | BloodPressure | SkinThickness | Insulin | BMI | DiabetesPedigreeFunction | Age | Outcome | |
|---|---|---|---|---|---|---|---|---|---|
| 0 | 6 | 148 | 72 | 35 | 0 | 33.6 | 0.627 | 50 | 1 |
| 1 | 1 | 85 | 66 | 29 | 0 | 26.6 | 0.351 | 31 | 0 |
| 2 | 8 | 183 | 64 | 0 | 0 | 23.3 | 0.672 | 32 | 1 |
| 3 | 1 | 89 | 66 | 23 | 94 | 28.1 | 0.167 | 21 | 0 |
| 4 | 0 | 137 | 40 | 35 | 168 | 43.1 | 2.288 | 33 | 1 |
df.values
array([[  6.   , 148.   ,  72.   , ...,   0.627,  50.   ,   1.   ],
       [  1.   ,  85.   ,  66.   , ...,   0.351,  31.   ,   0.   ],
       [  8.   , 183.   ,  64.   , ...,   0.672,  32.   ,   1.   ],
       ...,
       [  5.   , 121.   ,  72.   , ...,   0.245,  30.   ,   0.   ],
       [  1.   , 126.   ,  60.   , ...,   0.349,  47.   ,   1.   ],
       [  1.   ,  93.   ,  70.   , ...,   0.315,  23.   ,   0.   ]])
Matplotlib
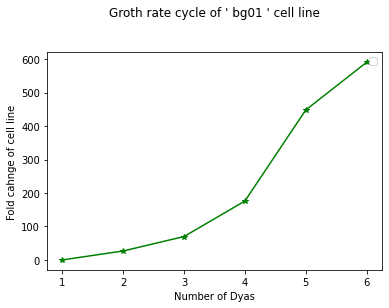
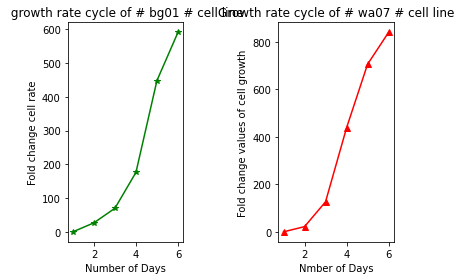
# we have cell growth rate or 2 cancer cell lines bg01 and wa07 and we have numbers as fold change values of growth
bg01 = [0.00,26.70,69.89,176.14,448.30,590.91]
wa07 = [0.00,21.88,126.56,438.28,706.25,840.63]
days = [1,2,3,4,5,6]

print(bg01)
print(type(bg01))
print(wa07)
print(type(wa07))
[0.0, 26.7, 69.89, 176.14, 448.3, 590.91]
<class 'list'>
[0.0, 21.88, 126.56, 438.28, 706.25, 840.63]
<class 'list'>
# plot bg01 groth rate curve

import matplotlib.pyplot as plt
%matplotlib inline

plt.plot(days, bg01, "g-*")
plt.xlabel("Number of Dyas")
plt.ylabel("Fold cahnge of cell line")
plt.title("Groth rate cycle of ' bg01 ' cell line\n\n")
plt.legend()
plt.show()
No handles with labels found to put in legend.
# plotting both plots in same using subplot

# plt.subplot(number of rows, number of columns, plot number)

plt.subplot(1,2,1)
plt.plot(days, bg01, "g-*", scaley= True, scalex= True)
plt.xlabel("Number of Days")
plt.ylabel("Fold change cell rate")
plt.title(" growth rate cycle of # bg01 # cell line")


plt.subplot(1, 2, 2)
plt.plot(days, wa07, "r-^", scaley= True, scalex= True)
plt.xlabel("Nmber of Days")
plt.ylabel("Fold change values of cell growth")
plt.title("Growth rate cycle of # wa07 # cell line")

plt.tight_layout()
plt.figure(figsize= (6,4), dpi= 300, )


plt.show()
<Figure size 1800x1200 with 0 Axes>
df.head()
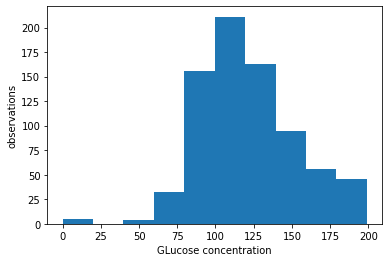
plt.hist(df["Glucose"])
plt.xlabel("GLucose concentration")
plt.ylabel("observations")
Text(0, 0.5, 'observations')
df.head()
| Pregnancies | Glucose | BP | ST | Insulin | BMI | DPF | Age | Outcome | |
|---|---|---|---|---|---|---|---|---|---|
| 0 | 6 | 148 | 72 | 35 | 0 | 33.6 | 0.627 | 50 | 1 |
| 1 | 1 | 85 | 66 | 29 | 0 | 26.6 | 0.351 | 31 | 0 |
| 2 | 8 | 183 | 64 | 0 | 0 | 23.3 | 0.672 | 32 | 1 |
| 3 | 1 | 89 | 66 | 23 | 94 | 28.1 | 0.167 | 21 | 0 |
| 4 | 0 | 137 | 40 | 35 | 168 | 43.1 | 2.288 | 33 | 1 |
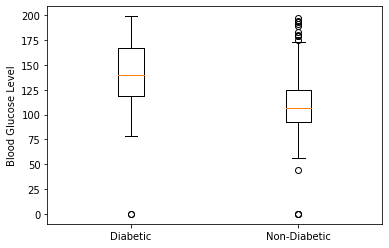
diabetic = df[df['Outcome']==1]['Glucose']
non_diabetic = df[df['Outcome']==0]['Glucose']
plt.boxplot([diabetic,non_diabetic],labels = ['Diabetic','Non-Diabetic'])
plt.ylabel("Blood Glucose Level")
plt.show()
/usr/local/lib/python3.7/dist-packages/matplotlib/cbook/__init__.py:1376: VisibleDeprecationWarning: Creating an ndarray from ragged nested sequences (which is a list-or-tuple of lists-or-tuples-or ndarrays with different lengths or shapes) is deprecated. If you meant to do this, you must specify 'dtype=object' when creating the ndarray.
  X = np.atleast_1d(X.T if isinstance(X, np.ndarray) else np.asarray(X))
Seaborn
import seaborn as sns
iris = sns.load_dataset("iris")
iris.head()
| sepal_length | sepal_width | petal_length | petal_width | species | |
|---|---|---|---|---|---|
| 0 | 5.1 | 3.5 | 1.4 | 0.2 | setosa |
| 1 | 4.9 | 3.0 | 1.4 | 0.2 | setosa |
| 2 | 4.7 | 3.2 | 1.3 | 0.2 | setosa |
| 3 | 4.6 | 3.1 | 1.5 | 0.2 | setosa |
| 4 | 5.0 | 3.6 | 1.4 | 0.2 | setosa |
from IPython.core.pylabtools import figsize
# set figure and axes
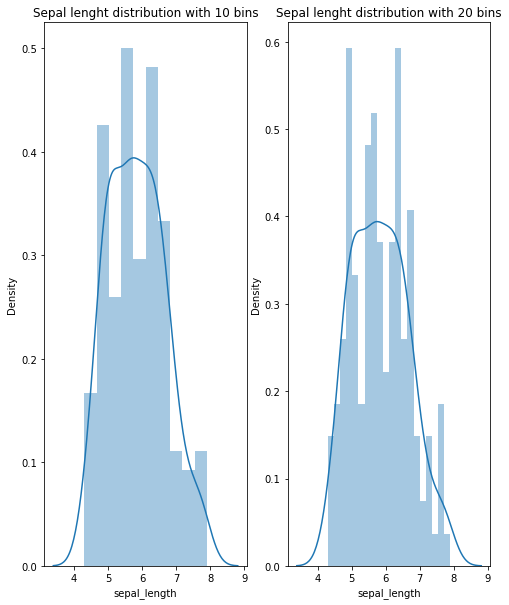
fig, axes = plt.subplots(nrows = 1, ncols=2 , figsize=(8, 10))

axes_0 = sns.distplot(iris["sepal_length"], kde= True, hist= True, bins= 10, ax= axes[0])
axes_0.set_title("Sepal lenght distribution with 10 bins")

axes_1 = sns.distplot(iris["sepal_length"], kde= True, hist= True, bins= 20, ax = axes[1])
axes_1.set_title("Sepal lenght distribution with 20 bins")
/usr/local/lib/python3.7/dist-packages/seaborn/distributions.py:2619: FutureWarning: `distplot` is a deprecated function and will be removed in a future version. Please adapt your code to use either `displot` (a figure-level function with similar flexibility) or `histplot` (an axes-level function for histograms).
warnings.warn(msg, FutureWarning)
Text(0.5, 1.0, 'Sepal lenght distribution with 20 bins')
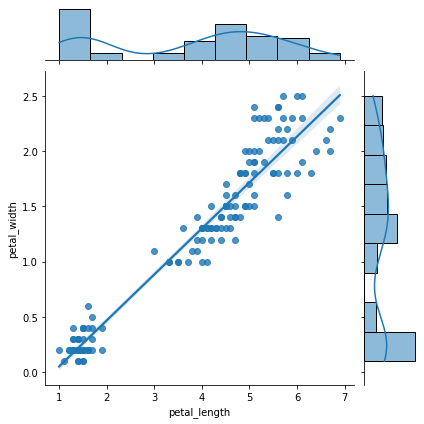
sns.jointplot(x = "petal_length", y = "petal_width", data= iris, kind= "reg")
<seaborn.axisgrid.JointGrid at 0x7f273fdcb390>
penguins = sns.load_dataset("penguins")
print(penguins)
    species     island  bill_length_mm  bill_depth_mm  flipper_length_mm  \
0    Adelie  Torgersen            39.1           18.7              181.0
1    Adelie  Torgersen            39.5           17.4              186.0
2    Adelie  Torgersen            40.3           18.0              195.0
3    Adelie  Torgersen             NaN            NaN                NaN
4    Adelie  Torgersen            36.7           19.3              193.0
..      ...        ...             ...            ...                ...
339  Gentoo     Biscoe             NaN            NaN                NaN
340  Gentoo     Biscoe            46.8           14.3              215.0
341  Gentoo     Biscoe            50.4           15.7              222.0
342  Gentoo     Biscoe            45.2           14.8              212.0
343  Gentoo     Biscoe            49.9           16.1              213.0

     body_mass_g     sex
0         3750.0    Male
1         3800.0  Female
2         3250.0  Female
3            NaN     NaN
4         3450.0  Female
..           ...     ...
339          NaN     NaN
340       4850.0  Female
341       5750.0    Male
342       5200.0  Female
343       5400.0    Male

[344 rows x 7 columns]
penguins.isna().sum()
species               0
island                0
bill_length_mm        2
bill_depth_mm         2
flipper_length_mm     2
body_mass_g           2
sex                  11
dtype: int64
penguins_final = penguins.dropna()
print(penguins_final)
print(penguins_final.isna().sum())
    species     island  bill_length_mm  bill_depth_mm  flipper_length_mm  \
0    Adelie  Torgersen            39.1           18.7              181.0
1    Adelie  Torgersen            39.5           17.4              186.0
2    Adelie  Torgersen            40.3           18.0              195.0
4    Adelie  Torgersen            36.7           19.3              193.0
5    Adelie  Torgersen            39.3           20.6              190.0
..      ...        ...             ...            ...                ...
338  Gentoo     Biscoe            47.2           13.7              214.0
340  Gentoo     Biscoe            46.8           14.3              215.0
341  Gentoo     Biscoe            50.4           15.7              222.0
342  Gentoo     Biscoe            45.2           14.8              212.0
343  Gentoo     Biscoe            49.9           16.1              213.0

     body_mass_g     sex
0         3750.0    Male
1         3800.0  Female
2         3250.0  Female
4         3450.0  Female
5         3650.0    Male
..           ...     ...
338       4925.0  Female
340       4850.0  Female
341       5750.0    Male
342       5200.0  Female
343       5400.0    Male

[333 rows x 7 columns]
species              0
island               0
bill_length_mm       0
bill_depth_mm        0
flipper_length_mm    0
body_mass_g          0
sex                  0
dtype: int64
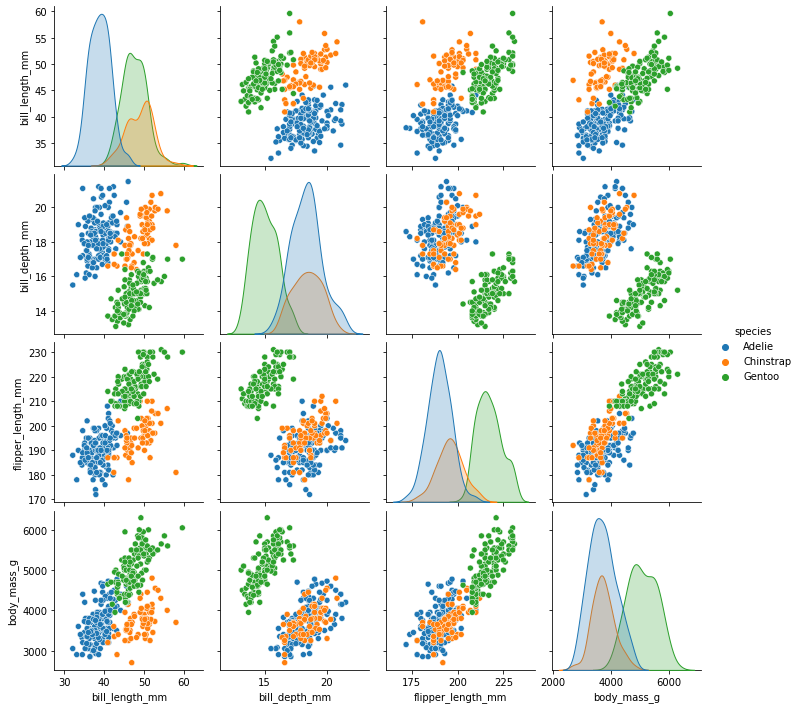
sns.pairplot(penguins_final, hue= "species")
<seaborn.axisgrid.PairGrid at 0x7f273f47b0d0>
penguins_final.head()

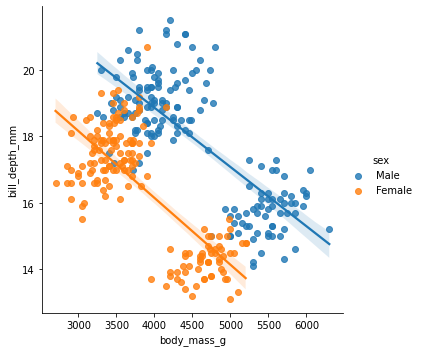
sns.lmplot(x = "body_mass_g", y="bill_depth_mm", data= penguins_final, hue= "sex")
<seaborn.axisgrid.FacetGrid at 0x7f2741d06fd0>
—Plotly—–
!pip install plotly
Looking in indexes: https://pypi.org/simple, https://us-python.pkg.dev/colab-wheels/public/simple/
Requirement already satisfied: plotly in /usr/local/lib/python3.7/dist-packages (5.5.0)
Requirement already satisfied: tenacity>=6.2.0 in /usr/local/lib/python3.7/dist-packages (from plotly) (8.0.1)
Requirement already satisfied: six in /usr/local/lib/python3.7/dist-packages (from plotly) (1.15.0)
import numpy as np
import matplotlib.pyplot as plt
%matplotlib inline
import seaborn as sns

import pandas as pd
pd.options.plotting.backend = "plotly"
# dataset from seaborn
penguins = sns.load_dataset("penguins")
penguins.head()
| species | island | bill_length_mm | bill_depth_mm | flipper_length_mm | body_mass_g | sex | |
|---|---|---|---|---|---|---|---|
| 0 | Adelie | Torgersen | 39.1 | 18.7 | 181.0 | 3750.0 | Male |
| 1 | Adelie | Torgersen | 39.5 | 17.4 | 186.0 | 3800.0 | Female |
| 2 | Adelie | Torgersen | 40.3 | 18.0 | 195.0 | 3250.0 | Female |
| 3 | Adelie | Torgersen | NaN | NaN | NaN | NaN | NaN |
| 4 | Adelie | Torgersen | 36.7 | 19.3 | 193.0 | 3450.0 | Female |
penguins["body_mass_g"].hist()
penguins["bill_depth_mm"].hist()
